- 05 Jun 2025
- 4 min read
- By Claire Ryan
Queensland property stands the test of time, says REIQ
Queensland’s property market has continued its upward momentum through the March 2025 quarter, with new data revealing just how far the market has come in the five years since the onset of the COVID-19 pandemic.
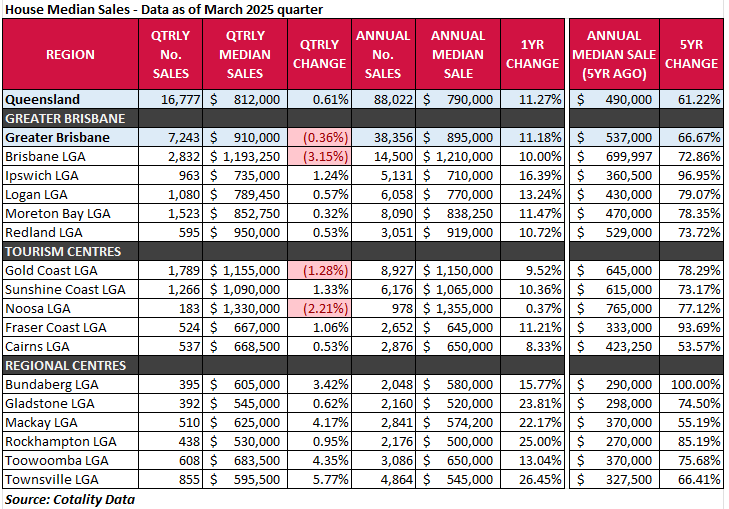
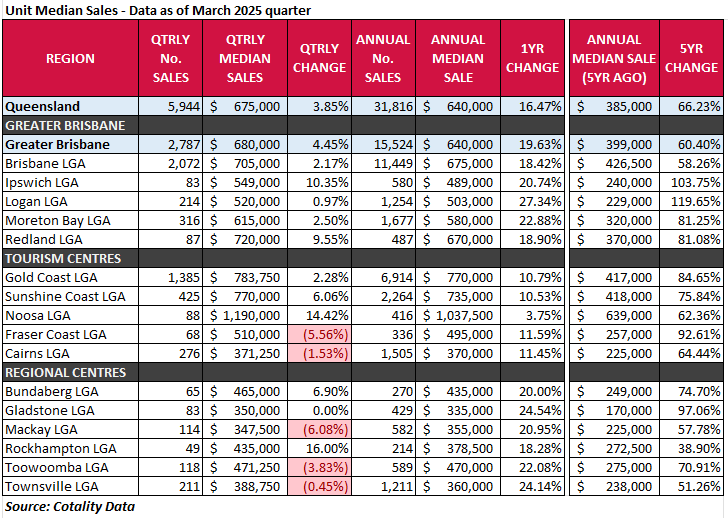
The latest median sales results released by the Real Estate Institute of Queensland (REIQ) show the state’s housing market notched up another quarter of steady performance, with the quarterly median sale price for houses edging up 0.61% to $812,000, and unit prices lifting 3.85% to $675,000.
REIQ CEO Antonia Mercorella said the latest figures not only reflect an active market in early 2025 but also highlight an exponential 5-year transformation with some regions doubling in value.
“In March 2020, as Australia was shutting its borders and grappling with economic uncertainly, Queensland’s annual median house price was just $490,000 – today it’s $790,000 representing a staggering 61.22% increase,” Ms Mercorella said.
“Queensland units have similarly surged from $385,000 to $640,000 – a 66.23% increase in the median sales price over the same five-year period. As prices have climbed, units have become a popular go-to option for buyers seeking more affordable entry points.
“Also, during this extraordinary period, around four years ago, our capital city was announced as the host of the Olympic Games – a milestone that begin building confidence in the capital and surrounds in the 2032 run up.
“Brisbane’s annual median house price has risen 72.86% in five years, now sitting at $1.21 million – and surprisingly, that rate doesn’t even make the podium finish for growth.
“It’s regional Queensland markets that were once undervalued that have seen some of the most exceptional growth. For example, house prices in Bundaberg have doubled over five years (100%), and Ipswich has seen a near doubling of its annual median price, up 96.95% since March 2020.
“Similarly for units, the unassuming areas on Brisbane’s outskirts of Ipswich and Logan LGAs have seen truly remarkable triple-digit growth of 103.75% and 119.65% respectively. Fraser Coast and Gladstone also recorded near-doubling of unit values.
“This strong growth in traditionally slower-moving markets is a sign of Queensland’s expanding demand footprint and deeper decentralisation. This is being fuelled by both owner-occupiers and investors seeking value and growth opportunities.”
Ms Mercorella said Queensland’s property market has not only weathered five years of economic, interest rate and policy shifts, but had defied expectations with our capital city’s dwelling value even overtaking Melbourne to become nation’s second most expensive market.[1]
Meanwhile, the gap between Brisbane and Sydney’s median dwelling values has narrowed to just 24% - the closest margin since 2013 – compared to 42% five years ago.[2]
“This has been an incredibly steep growth trajectory, but it does go to show what difference a handful of years can make when it comes to getting your foot on the property ladder,” she said.
“While many property owners have benefitted from this boom, there is no escaping the fact that a growing affordability issue has emerged. The pace at which prices have raced away has left many prospective buyers feeling left behind and locked out.
“If we want to enable sustainable price growth and ensure future generations the same opportunity to own a home, housing policy must be squarely focused on supply. Any attempt to improve affordability without significantly increasing housing stock is doomed to fall short.
“Higher density and diversity of housing is part of the solution, but we must also address deeper structural barriers to new freestanding housing. Challenges such as escalating construction costs, labour shortages, poor productivity, land scarcity and delays within planning and approval systems, must be addressed.
“We need consistent, long-term investment in driving housing supply, including structural reform and smarter financial incentives to drive productivity and delivery.
“We're seeing some improvements in conditions – construction materials costs are easing and are more readily available, interest rates are coming down, and approvals are starting to lift - but supply remains well below what’s needed.
“We need to pull every supply lever available - not just for this generation, but for the next. Every Queenslander should be able to aspire to home ownership.”
Ms Mercorella said while statewide growth in house prices had moderated this quarter, it was still moving in a northerly direction.
“This quarter’s steadier performance likely reflects a combination of factors – including buyer hesitancy around the Federal election and lingering interest rate uncertainty which may have temporarily subdued selling and buying activity,” she said.
“However, strong economic and demographic fundamentals underpin Queensland property performance, alongside slower than required dwelling construction, which means demand exceeds supply at prevailing prices, generating upward price pressure.
“Relative affordability, lifestyle appeal, demographic shifts, low unemployment (4.2% seasonally adjusted in April 2025) and strong population growth are all additional factors buoying Queensland property.”
The Australian Government’s National Housing Accord targets the delivery of 1.2 million new, well-located homes over five years to June 2029. This translates to around 49,300 new homes per year in Queensland. Total dwelling completions reached around 31,800 over the 12 months to the December quarter of 2024, which is well below our target.[3]
Queensland is experiencing strong population growth, driven by interstate and overseas migration, yet dwelling completions are failing to keep pace. Queensland's yearly population growth has consistently exceeded Australia's, reaching a peak of 2.7% in September 2023, compared to the national growth of 2.5%. By September 2024, Queensland's annual growth had moderated to 2.0%, but still above Australia’s at 1.8%.[4]
House market highlights
Queensland’s house market continued its trajectory of stability and long-term growth in the March 2025 quarter, adding to already impressive gains made over the past year. At the state level, the median sale price for houses grew 0.61% over the quarter to $812,000. On an annual basis, this represents an 11.27% increase.
Top performers: The regions continued to shine, with Townsville standing out for its strong quarterly growth of 5.77% to $595,500. Toowoomba followed closely with a 4.35% rise to $683,500, while Mackay jumped 4.17% to $625,000 and Bundaberg lifted 3.42% to $605,000.
Greater Brisbane saw a slight quarterly easing of 0.36% to $910,000, influenced by a 3.15% dip in Brisbane LGA to $1.193 million. However, surrounding LGAs remained solid. Ipswich rose 1.24% to $735,000, Logan climbed 0.57% to $789,450, Moreton Bay edged up 0.32% to $852,750, and Redland increased 0.53% to $950,000 – all outpacing the capital. Annual growth in these markets was also impressive, with Townsville up 26.45%, Rockhampton up 25%, Mackay up 22.17%, and Gladstone up 23.81%.
The highest volume of house sales over the quarter were recorded in Brisbane (2,832), followed by Gold Coast (1,789), Moreton Bay (1,523), and Sunshine Coast (1,266).
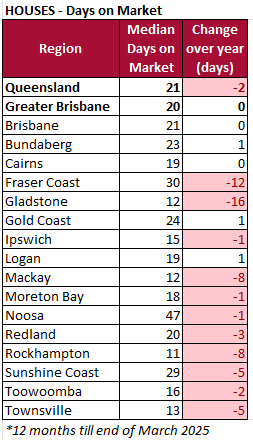
Across the state, median days on market remained stable or improved, with houses in Queensland taking a median of 21 days to sell (two days faster than a year ago), and units selling in a median of 19 days (one day faster than last year). The fastest-moving house markets were once again Rockhampton (11 days), Mackay and Gladstone (12 days), and Townsville (13 days), highlighting sustained demand in Queensland’s regional centres. Noosa remained the slowest-moving house market at 47 days, although that was still a slight improvement on the previous quarter.
HOUSES DATA
Unit market highlights
Across the unit market, momentum was stronger than the house market over the March quarter, with several lifestyle and regional areas leading the way. Statewide, the median unit price rose 3.85% over the March quarter to $675,000. On an annual basis, unit prices are up 16.47%, and over five years they have grown by a remarkable 66.23%.
Top performer: Noosa commands premium values and remained the most expensive unit market in the state, climbing 14.42% this quarter to reach a median of $1.19 million.
Greater Brisbane’s unit market recorded robust quarterly growth of 4.45% to reach a median of $680,000. Within this, Brisbane LGA lifted 2.17% to $705,000. Ipswich showed standout quarterly growth of 10.35% to $549,000, while Redland rose 9.55% to $720,000. Sunshine Coast also impressed with a 6.06% increase to $770,000. Over the past year, Logan (up 27.34%), Toowoomba (22.08%), and Gladstone (24.54%) posted the strongest annual unit price growth.
While unit markets in Mackay (-6.08%), Fraser Coast (-5.56%), Toowoomba (-3.83%), Cairns (-1.53%) and Townsville (-0.45%) saw quarterly softening, all recorded strong annual growth, underpinned by solid demand and lower price points compared to southeast Queensland.
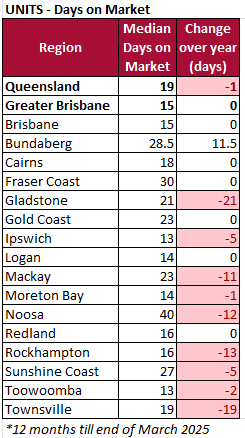
The highest volume of unit sales were in Brisbane (2,072) and Gold Coast (1,385), followed by Sunshine Coast (425) and Moreton Bay (316). Across Queensland, units sold more quickly this quarter, with the median days on market falling to 19 days. The fastest markets were Ipswich, Toowoomba, and Moreton Bay, all recorded the shortest sales campaigns averaging at 13 to 14 days. Gladstone showed the most notable change, cutting its median days on market by 21 days over the year to now sit at 21.
UNITS DATA
DAYS ON MARKET
Notes to Editors:
- Insights derived by the Real Estate Institute of Queensland based on Cotality Data.
- A median sale price is derived by arranging a set of sale prices from lowest to highest and the selecting the middle value within this set (i.e. the 50th percentile, where half of recorded sales were less and half were higher than the median).
- Only suburbs and regions to record sufficient sales numbers (at least 10 sales for the quarter) at the time of reporting are considered statistically significant.
- Days on market is calculated as the median number of days it has taken to sell properties (from first advertised date to contract date) by private treaty during the last 12 months (excludes auction listings and listings where an asking price is not advertised).
ENDS
Media enquiries:
Claire Ryan, Media and Stakeholder Relations Manager, The Real Estate Institute of Queensland
M: 0417 623 723 E: media@reiq.com.au
Read another media release from the REIQ: REIQ welcomes rate relief amid heightening housing pressure.
Or browse our suite of media releases.
[1] According to Cotality data, Brisbane city has recorded the second-highest median dwelling value, and Greater Brisbane’s 3-month average median sales price has exceeded that of Greater Melbourne’s since mid-2024.
[2] CoreLogic Brisbane housing market presentation - May 2025
[4] Australian Bureau of Statistics (2024) National, State and Territory Population - https://www.abs.gov.au/statistics/people/population/national-state-and-territory-population/latest-release
You might also like
View All Articles
View All Articles


Start your Real Estate Career
Need help? 1300 697 347 or contact us