- 31 Mar 2026
- 3 min read
- By Claire Ryan
Queensland property prices pushed up by persistent supply pressures
Chronic construction constraints for new housing coupled with a listings drought for established homes, saw virtually all of Queensland’s major regions’ median house sale prices rise in the final quarter of 2025 and year-on-year.
In fact, looking at the change over the year in median sales prices, double-digit annual growth rates were recorded for both houses and units across most of the LGA centres.
The Real Estate Institute of Queensland’s (REIQ) latest median sales data for the December 2025 quarter (October – December 2025) show the statewide median house price rose 6.11% over the quarter and 13.7% over the year. For Queensland’s unit market, the growth rate was even higher, at 7% for the quarter and 16.13% for the year.
After becoming a million-dollar-median market last quarter, the Redlands LGA recorded the highest quarterly growth for median house prices in the December quarter at 7.37% to $1,115,000.
In the unit market, it was Moreton Bay LGA - one of the fastest-growing regions in Queensland - where prices also grew the most in the December quarter, rising 12.14% to $729,500.
Our capital city also saw a strong uplift but was outperformed by other regions, rising 4.07% to a quarterly median of $1,405,000 for houses, and up 7.14% to $825,000 for units.
REIQ CEO Antonia Mercorella said as property prices continued to march upward, our state’s significant housing supply shortfall was incredibly concerning.
“We’re still not building at the scale and speed we need to relieve the supply squeeze, and with every quarterly target not met, we’re falling further behind,” Ms Mercorella said.
“Under the National Housing Accord set from mid-2024, Queensland needs to build just over 49,000 new dwellings each year over five years – however, over each of the last four quarters (data to September 2025), only about 34,000 new dwellings were completed.[1]
“Further, the pipeline is far from full. In January this year, there were only 3,600 building approvals, compared with approximately 4,100 required each month. Approvals are currently running at 42,700 per annum – which is approximately 13% below the target.[2]
“The properties we do have in the pipeline are heavily skewed towards high-end product – such as luxury apartments – due to high construction costs influencing feasibility.
“The established housing market is still drip-feeding properties for sale but remains restricted as property owners hold on tight to their homes.
“Total listings during December 2025, show the Brisbane market had a 25% fall in listings relative to the equivalent period last year, while regional Queensland fell 15%. This was not just a seasonal phenomenon, with recent February data suggesting similar shortfalls.[3]
“These persistent supply pressures are what’s underpinning property price growth, along with ongoing demand-side factors such as high interstate migration, expected strong population growth, and rental market strain seeing tenants transition to home ownership.
“First home buyers were also buoyed by the Federal Government’s 5% Deposit Scheme this quarter which came into effect on 1 October 2025, lowering the deposit barrier to entry with property price thresholds of $1 million in Brisbane, Gold Coast and the Sunshine Coast, and $700,000 in other Queensland areas.
“Competition for housing is intensified around the lower quartiles of the market where affordability is greatest and it’s perceived potential gains are highest, and this demand tapers off as you move up the price spectrum, reflecting an increasingly divided two-speed market.”
Ms Mercorella said the flow on impact of rising interest rates and recent global conflict could act as fuel on the fire of the construction crisis.
“While we’re all feeling the impact of global conflict at the petrol pump, the flow on inflationary impact to manufacturing and construction, through higher transport and logistics costs, couldn’t come at a worse time,” Ms Mercorella said.
“Counting the cranes on the horizon has traditionally been a promising sign of what’s in the immediate pipeline, but with high-cost risks and exposure for builders and developers comes uncertainty.
“We’re already up against low productivity, rising material costs, and dire labour shortages in the context of Olympics-related infrastructure projects, so unfortunately this does not bode well for new housing supply.”
House market insights
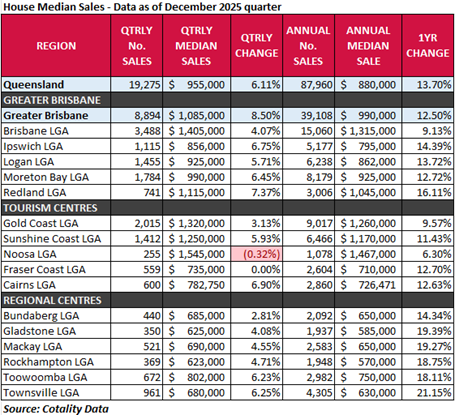
Queensland’s house market continued to perform strongly in the December 2025 quarter. The statewide median sale price for houses grew 6.11% over the quarter to $955,000. On an annual basis, this was a 13.7% rise to an annual median of $880,000. Top performers: The Redlands LGA took out the top spot for quarterly median house sales price growth of 7.37% to $1,115,000. A mix of Greater Brisbane and regional LGAs took out the remaining top five places for quarterly growth including Cairns rising 6.9% to $782,750, Ipswich up 6.75% to $856,000, Moreton Bay up 6.45% to $990,000 and Townsville up 6.25% to $680,000. Annual median house sales price growth in the Redlands was also significant at 16.11% to $1,045,000 – yet this did not earn it a top-five spot, following Townsville (21.15%), Gladstone (19.39%), Mackay (19.27%), Rockhampton (18.75%), and Toowoomba (18.11%). The highest volume of quarterly house sales were recorded in Brisbane (3,488), followed by Gold Coast (2,015), Moreton Bay (1,784), Logan (1,455) and Sunshine Coast (1,412).
Unit market insights
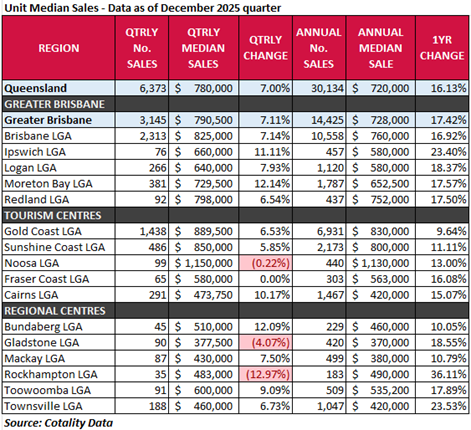
In the unit market, double-digit quarterly median sale price growth was recorded in the top four performing LGAs with Moreton Bay (12.14% to $729,500), Bundaberg (12.09% to $510,000, Ipswich (11.11% to $660,000) and Cairns (10.17% to $473,750), closely followed by Toowoomba LGA (9.09% to $600,000).
While Rockhampton’s unit market appeared to take a dramatic 12.97% dive this quarter, it’s worth noting that this is based on only 35 sales so would not be considered as statistically significant. In fact, Rockhampton’s annual performance suggests a 36.11% rise over 12 months to $490,000 – the highest in the state.
Other top annual unit growth performers were Townsville (23.53%), Ipswich (23.4%), Gladstone (18.55%), and Logan (18.37%).
Units remained ever popular in Brisbane (2,313 sales), and the Gold Coast (1,438 sales) over the quarter. Noosa units’ quarterly median remained miles ahead at $1.15 million, followed by the Gold Coast ($889,500), Sunshine Coast ($850,000) and Brisbane $825,000) – perhaps attracting first home buyers who could take advantage of government schemes.
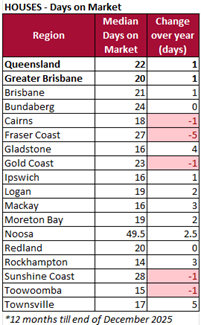
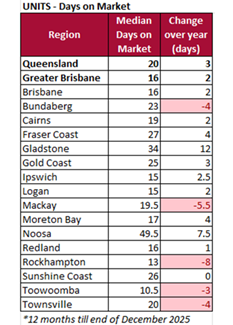
Across the state, median days on market for units remained fast at just 20 days – albeit 3 days longer than the previous year. The Toowoomba unit market is heating up taking a median of only 10.5 days to sell, followed by Rockhampton (13 days), and Logan and Ipswich (15 days).
Days on market insights
Notes to Editors:
- Insights derived by the Real Estate Institute of Queensland based on Cotality Data.
- A median sale price is derived by arranging a set of sale prices from lowest to highest and the selecting the middle value within this set (i.e. the 50th percentile, where half of recorded sales were less and half were higher than the median).
- Only suburbs and regions to record sufficient sales numbers (at least 10 sales for the quarter) at the time of reporting are considered statistically significant.
- Days on market is calculated as the median number of days it has taken to sell properties (from first advertised date to contract date) by private treaty during the last 12 months (excludes auction listings and listings where an asking price is not advertised).
ENDS
Media enquiries:
Claire Ryan, Media and Stakeholder Relations Manager, The Real Estate Institute of Queensland
M: 0417 623 723 E: media@reiq.com.au
Read another media release from the REIQ: Essential costs drive inflation yet borrowers pay the price.
Or browse our suite of media releases.
[2] On an annualised trend basis (meaning the latest monthly ABS Trend estimate multiplied by 12). https://www.abs.gov.au/statistics/industry/building-and-construction/building-approvals-australia/jan-2026/8731007.xlsx
[3] Cotality Monthly Chart Pack for December 2025 listings and Cotality Monthly Chart Pack for February 2026 listings.
You might also like
View All Articles
View All Articles


Start your Real Estate Career
Need help? 1300 697 347 or contact us